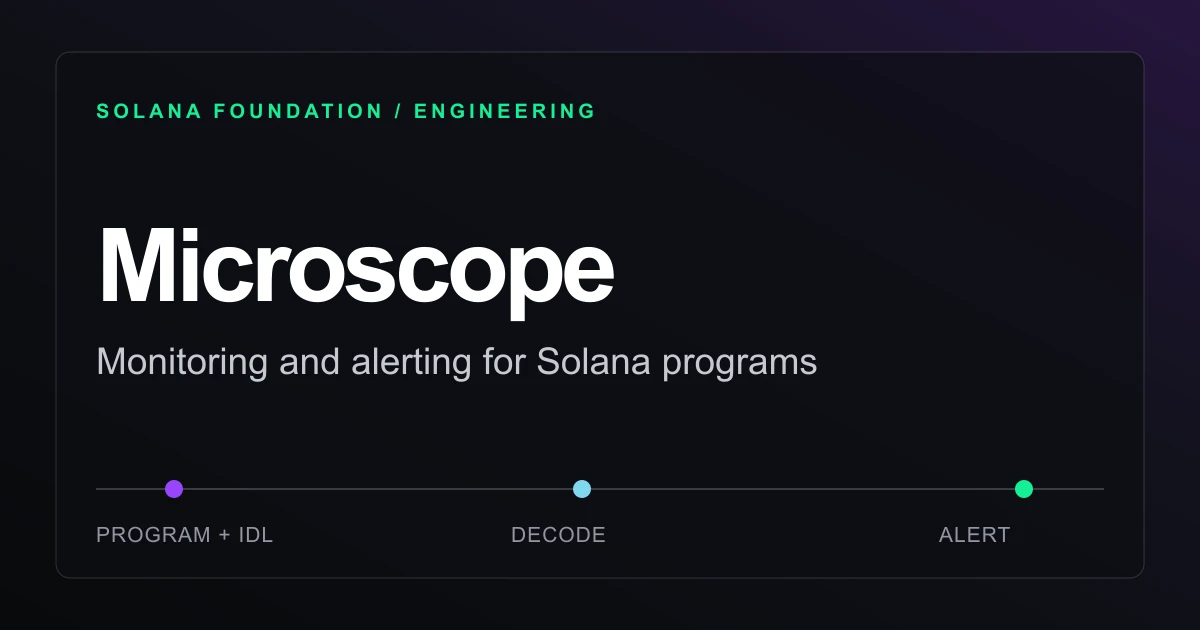
 solana.comtool
Introducing Solana Microscope: Program Monitoring and Alerts
Microscope is an open-source, self-hosted monitoring and alerting tool for Solana programs that decodes a program's instructions and events using its IDL, then renders that activity as Grafana dashboards backed by Loki (logs) and Prometheus (metrics). It can also watch a Squads multisig controlling the program, firing precise alerts on specific instructions, events, field values, or multisig proposal approvals to Slack, Telegram, or PagerDuty. A distinguishing feature is built-in health alerting for the monitoring pipeline itself (stalled gRPC/RPC streams, corrupt checkpoints, records decoded but not reaching Loki), so teams can distinguish "program is quiet" from "monitoring is broken." It deploys via Docker Compose, Terraform (AWS/GCP), or Kubernetes manifests, and the code is MIT-licensed on GitHub.
What it is
Microscope is a monitoring stack for a single Solana program (and optionally one Squads multisig) per deployment. It reads confirmed transactions via a Yellowstone gRPC stream or a Solana RPC endpoint, decodes them against the program's IDL, and feeds structured records to Loki and metrics to Prometheus, visualized in Grafana.
How it works
The indexer consumes the transaction feed, decodes instructions/events using the IDL, and writes decoded records to Loki with metrics to Prometheus. Grafana dashboards show transaction/instruction error rates, decoded instructions by type, recent events, and multisig activity; if the datasource is RPC polling, the dashboard also surfaces polling health. Alerts carry a signal_kind label distinguishing two classes: activity alerts (a specific instruction, event, field value, or multisig proposal approval) versus datasource alerts (pipeline problems — stalled gRPC/RPC stream, stale polls, corrupt checkpoint, or records decoded but not reaching Loki). This separation is the point: a failed on-chain instruction still counts as program activity, not an indexer failure, so an empty dashboard is deliberately ambiguous between "program quiet" and "monitoring broken" until the datasource alerts are checked.
flowchart TD
    A[Confirmed tx via gRPC or RPC] --> B[Indexer decodes via IDL]
    B --> C[Loki: logs]
    B --> D[Prometheus: metrics]
    C --> E[Grafana dashboard/alerts]
    D --> E
    E --> F{signal_kind}
    F -->|activity| G[Instruction/event/multisig alert]
    F -->|datasource| H[Pipeline health alert: stalled stream, stale poll, corrupt checkpoint]
Preconditions / Affected
One deployment covers exactly one program and, optionally, one Squads multisig — multi-program monitoring requires multiple deployments. Configuration requires the program ID, the IDL, a chosen transaction source (gRPC or RPC), and defined alert conditions.
What to do
- Provide program ID + IDL, pick a transaction source, define activity-trigger rules; multisig config is optional.
- Deploy via Docker Compose, Terraform (AWS/GCP VM), Kubernetes reference manifests, or connect the indexer and Alloy to an existing Grafana Cloud stack.
- Use the included
setup-deploymentskill to let an AI agent prepare/validate the config, and reference the Jupiter Lend walkthrough as a sample alert set. - When a dashboard goes quiet, check
signal_kind/datasource alerts before concluding the program is inactive — the repo includes a diagnosis workflow and an operations guide for this.
Caveats
Health-alert coverage is scoped to the conditions the page names (stalled stream, stale RPC polls, corrupt checkpoint, decoded-but-undelivered records); it does not claim broader failure-mode coverage.
Organisations named here
- Squads
Technologies named here
- Solana programs
- Microscope
- Yellowstone gRPC
- Squads multisig
- Solana RPC endpoint
- Grafana
- Loki
- Prometheus
- Slack
- Telegram
- PagerDuty
- Docker Compose
- Terraform
- Grafana Cloud
- Alloy
- Kubernetes
- Solana
- Docker
Techniques named here
- Decoded activity alerting
- Multisig action monitoring
- Monitoring pipeline health checking
Related in Blue Team & Detection
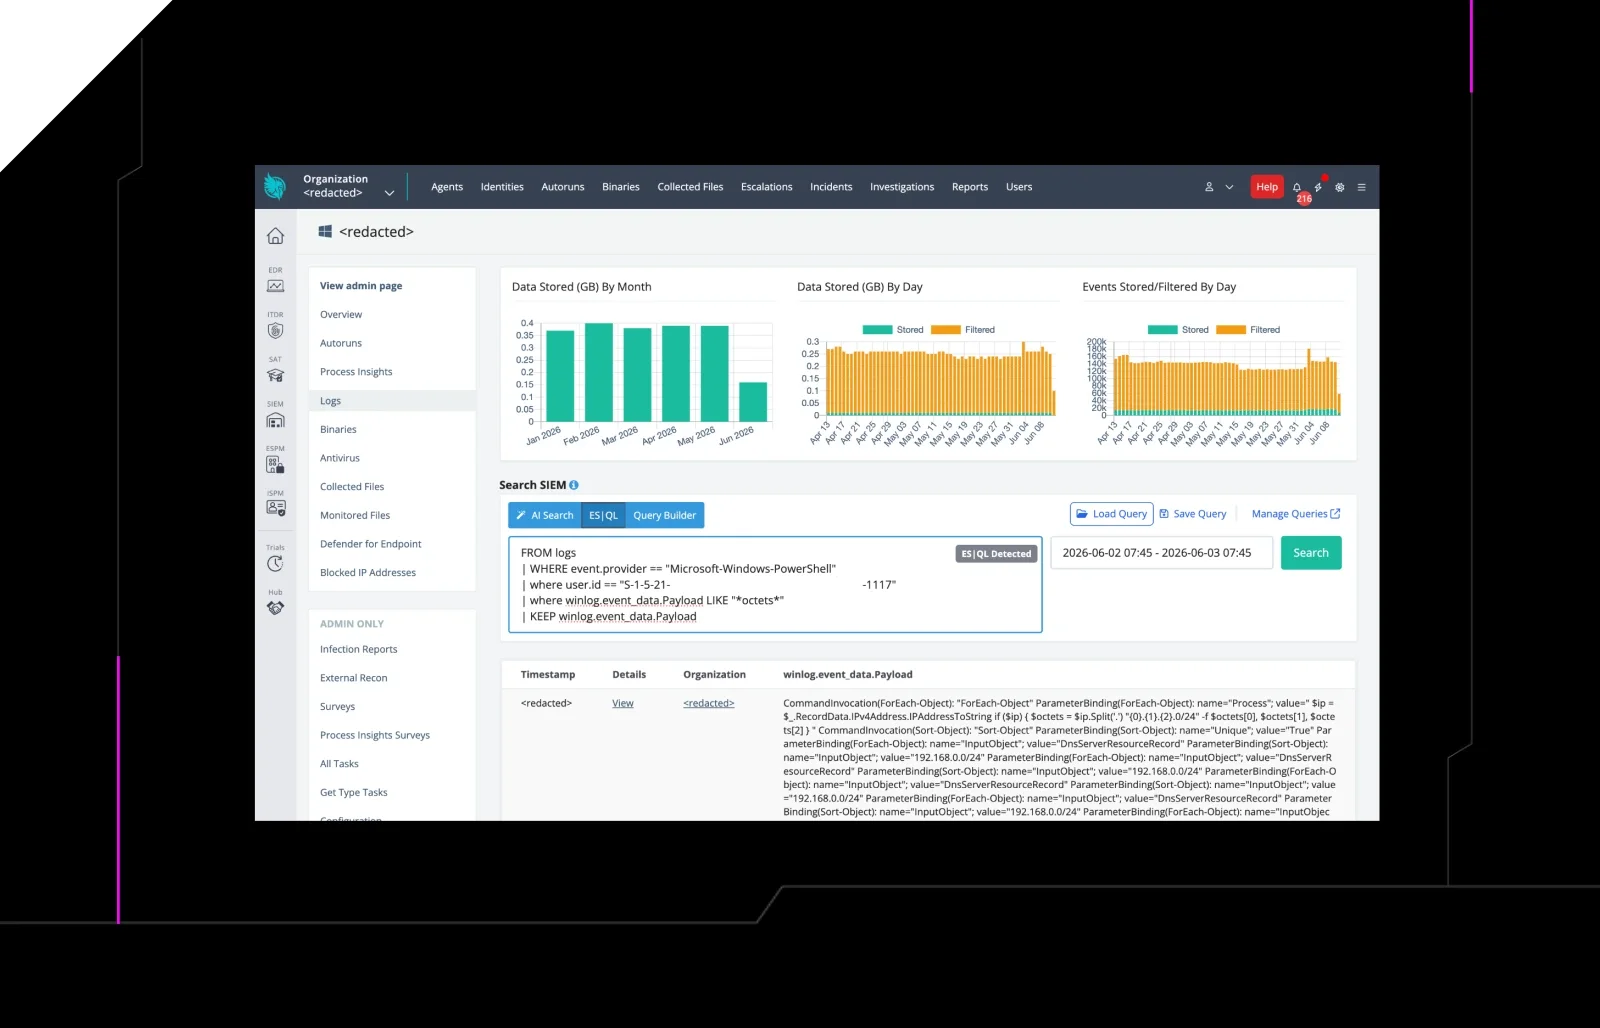
 huntress.comwriteup
AI-Coded Malware | Analyzing Vibe-Coded AD Enumeration | Huntress
 blog.talosintelligence.comtool
Introducing CAIRN: Frontier tracking for AI-integrated malware (Cisco Talos)
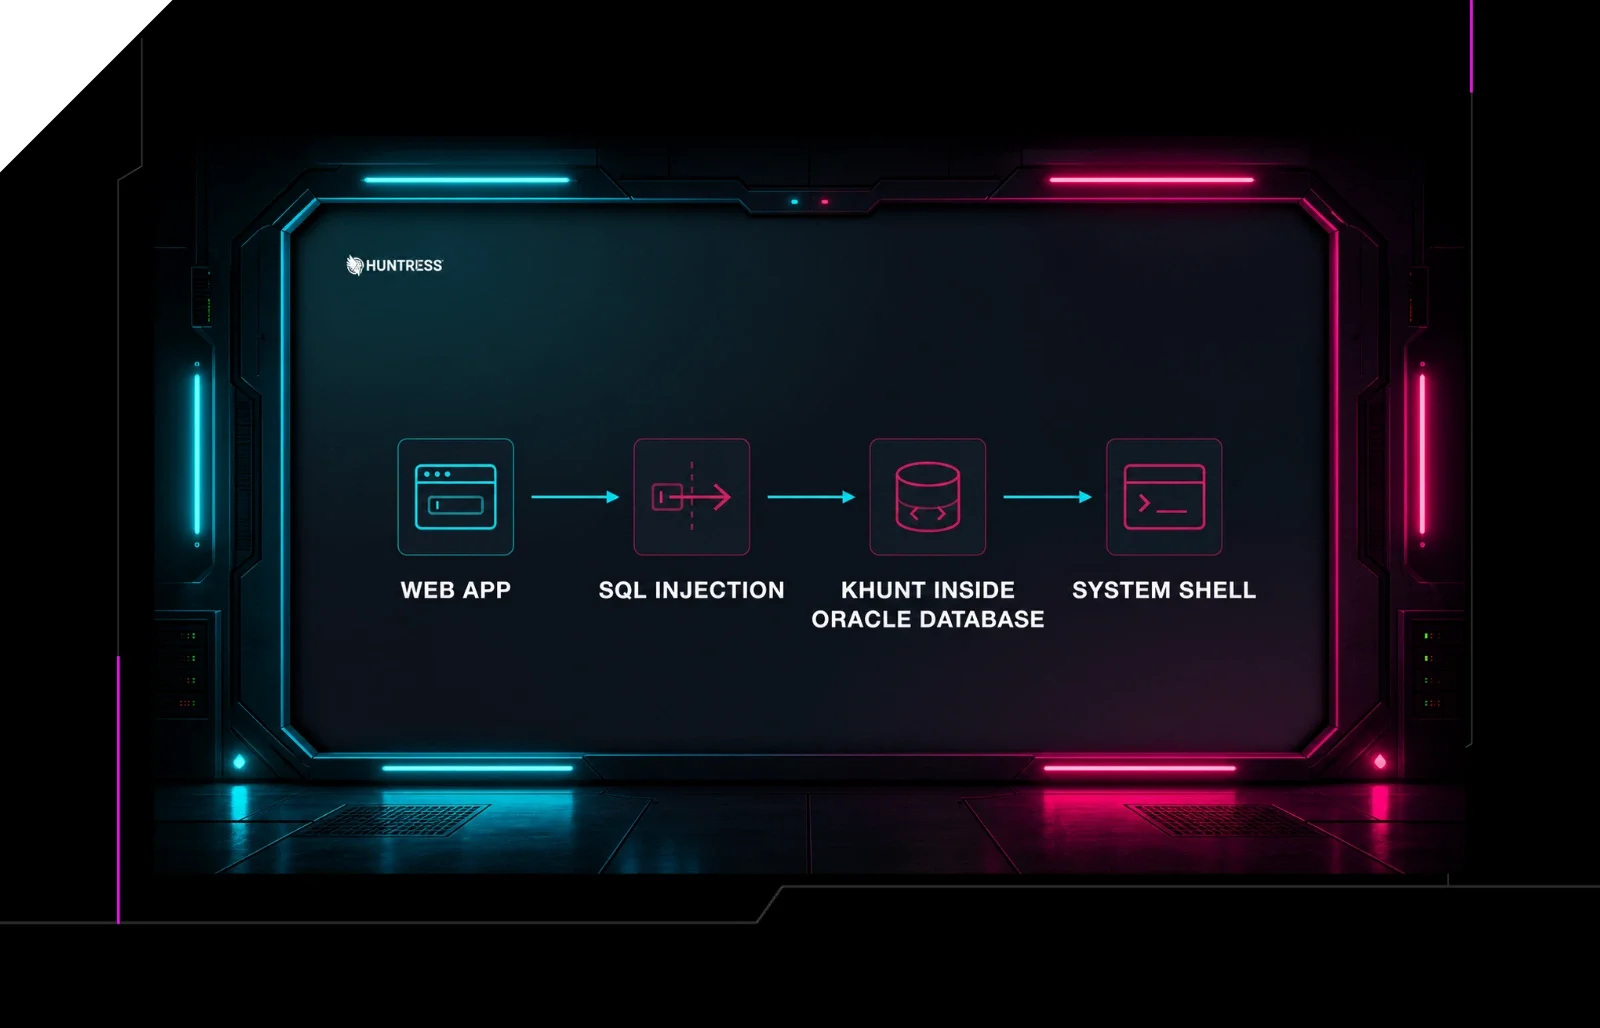 huntress.comwriteup
Inside an Oracle Database SQL Injection Attack | Huntress
 huntress.comwriteup