 interconnects.aiarticle
How well can we measure open model inference share?
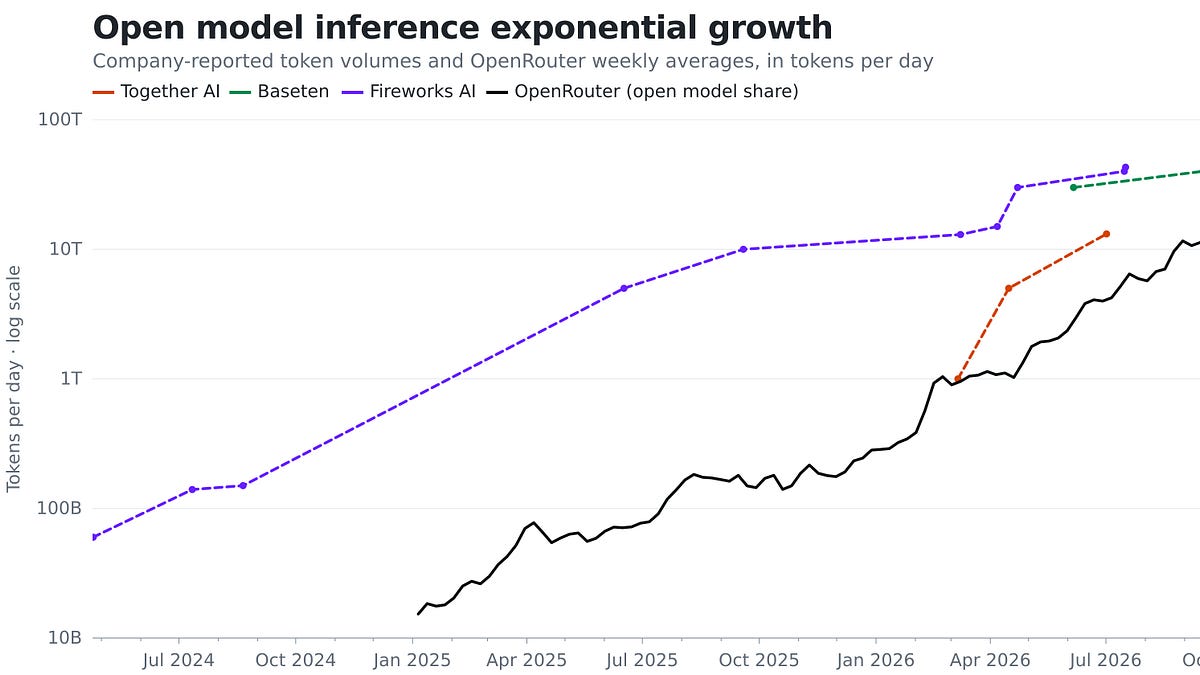
Interconnects research note by Nathan Lambert estimating the market for open model inference. It uses public token-volume disclosures from Baseten, Fireworks and Together AI, plus OpenRouter's open model share, and overlays Google's reported platform token volumes. Fireworks reports more than 40T tokens per day on customized models, a vertical that grew over 2x since summer 2026. The fetched text cuts off before the conclusions.
What it claims
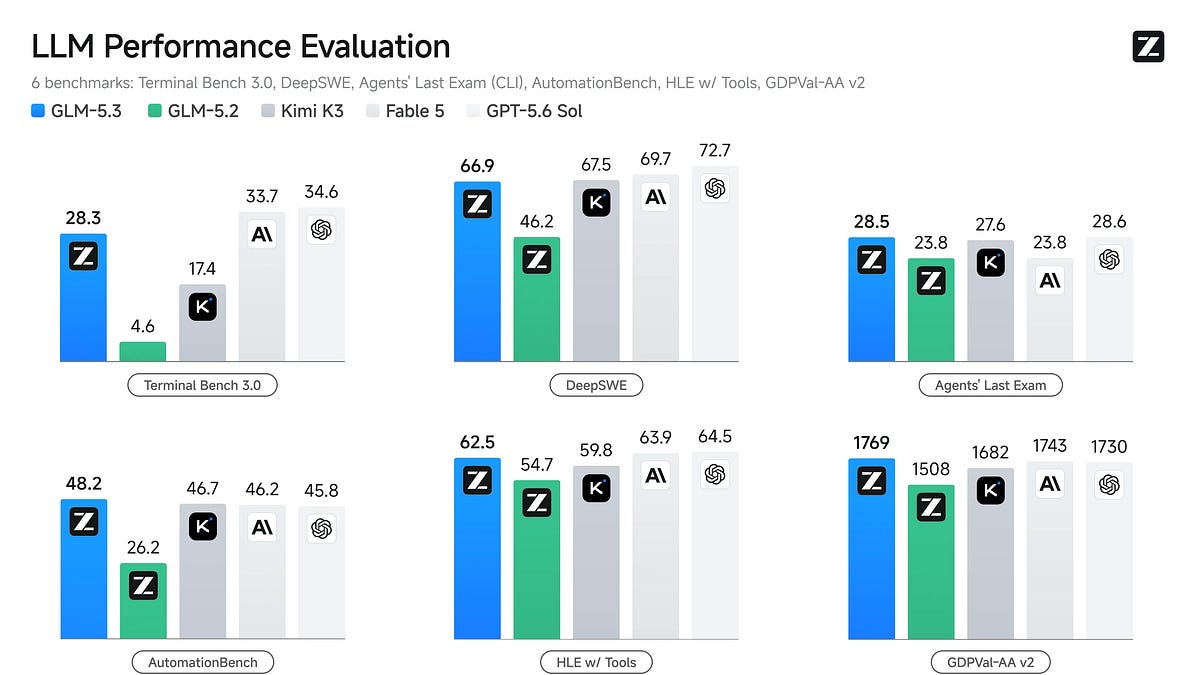
Nathan Lambert argues that open model inference is growing near-exponentially, based on token-volume disclosures from Baseten, Fireworks and Together AI plotted on a log scale. He says this trend predates the further uptick he expects from GLM 5.2, which he calls a step change in open agents.
Fireworks announced at its first company conference that it serves more than 40T tokens per day to customers' customized models. Fireworks said that vertical grew over 2x since the summer. From this, Lambert forecasts that Fireworks' total volume will be "well above 100T tokens" per day at its next update in the fall. This is his projection, not a figure Fireworks disclosed.
The note asks whether open inference is growing and whether it is "a rounding error" next to OpenAI and Anthropic. The fetched text ends before it answers either question.
How it works
The method has four inputs:
- Startup volumes. Lambert uses Baseten, Fireworks and Together AI as bellwethers. He reasons that their fortunes track open model inference as a category more directly than the hyperscalers' do.
- OpenRouter. He adds OpenRouter's open model share of token volume, which OpenRouter reports through its API.
- Google. He overlays Google's platform-wide and API token volumes from its earnings reports, as a closed and hyperscale reference point.
- Dashboard. The data feeds the Interconnects Dashboard, a free aggregator of open model adoption and performance data. Lambert built it as an agent testbed.
Limits
- Imprecise sources. Lambert calls all open adoption measurements "incredibly imprecise". The inputs are noisy platform metrics, marketing-driven startup disclosures and imperfect public evaluations.
- Hyperscalers missing. Amazon Bedrock and Azure's model garden likely serve a lot of open model traffic, but neither breaks usage down by model category. That traffic is absent from the estimate.
- Partial Fireworks figure. The 40T tokens/day number covers only customized models, not all Fireworks inference.
- Raw and partly paywalled. The research notes are explicitly rawer than Lambert's usual articles and are mostly paid. The dashboard data stays free. People in AI policy or policy-facing research can ask for discounted or free access.
- Truncated text. The fetched text stops at the Google overlay plot. The chart values and any conclusions are not available.
Organisations named here
- Interconnects
- Baseten
- Fireworks
- Together AI
- OpenRouter
- OpenAI
- Anthropic
- Microsoft Azure
- Amazon
- Microsoft
Technologies named here
- Interconnects Dashboard
- GLM-5.2
- OpenRouter
- Baseten
- Fireworks
- Together AI
- Amazon Bedrock
- Microsoft Azure
- Azure model garden
Concepts named here
- Bellwether providers
- GLM-5.2
- Nathan Lambert
- Open model inference share
- Token volume
Related in ai-policy



 futureoflife.orgarticle
Future of Life Institute AI Safety Index — Summer 2026
 interconnects.aiarticle
Lessons from the hacks
 interconnects.aiarticle